District Information
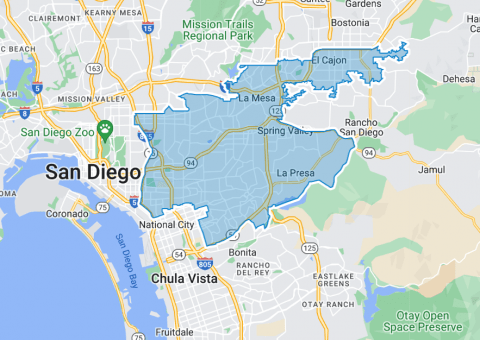
DISTRICT AD79
2020 Census Population (adj Elec. §21003)
| Name | Count | Percent |
|---|
| Total Population (POP) | 505,901 | 100.00% |
|---|
| POP Hispanic or Latino | 217,636 | 43.02% |
|---|
| POP Not Hispanic or Latino (NH) | 288,265 | 56.98% |
|---|
| POP NH Population of one race | 265,829 | 52.55% |
|---|
| POP NH White alone | 136,745 | 27.03% |
|---|
| POP NH Black or African American alone | 56,467 | 11.16% |
|---|
| POP NH Asian alone | 65,703 | 12.99% |
|---|
| POP NH American Indian and Alaska Native alone | 1,345 | 0.27% |
|---|
| POP NH Native Hawaiian and Other Pacific Islander alone | 2,846 | 0.56% |
|---|
| POP NH Some Other Race alone | 2,723 | 0.54% |
|---|
| POP NH Population of two or more races | 22,436 | 4.43% |
|---|
2020 Census Housing Occupancy Status
| Name | Count | Percent |
|---|
| Total Housing Units | 169,558 | 100.00% |
|---|
| Occupied | 163,995 | 96.72% |
|---|
| Vacant | 5,563 | 3.28% |
|---|
2020 Census Group Quarters Population (adj Elec. §21003)
| Name | Count | Percent |
|---|
| Total Group Quarters Population: | 6,572 | 100.00% |
|---|
| Institutionalized population: | 3,447 | 52.45% |
|---|
| Correctional facilities for adults | 17 | 0.26% |
|---|
| Juvenile facilities | 98 | 1.49% |
|---|
| Nursing facilities/Skilled-nursing facilities | 3,122 | 47.50% |
|---|
| Other institutional facilities | 210 | 3.20% |
|---|
| Noninstitutionalized population: | 3,125 | 47.55% |
|---|
| College/University student housing | 634 | 9.65% |
|---|
| Military quarters | 222 | 3.38% |
|---|
| Other noninstitutional facilities | 2,269 | 34.53% |
|---|
Counties In District
| Name | Count | Percent |
|---|
| San Diego | 505,895 | 15.32% |
|---|
Places In District
| Name | Count | Percent |
|---|
| SAN DIEGO: Bonita(U) | 2,146 | 16.58% |
|---|
| SAN DIEGO: El Cajon(C) | 73,475 | 68.94% |
|---|
| SAN DIEGO: La Mesa(C) | 61,266 | 100.00% |
|---|
| SAN DIEGO: La Presa(U) | 35,168 | 100.00% |
|---|
| SAN DIEGO: Lemon Grove(C) | 27,743 | 100.00% |
|---|
| SAN DIEGO: San Diego(C) | 275,006 | 19.79% |
|---|
| SAN DIEGO: Spring Valley(U) | 31,085 | 100.00% |
|---|
| SAN DIEGO: Remainder of San Diego(R) | 6 | 0.00% |
|---|
